top of page

Least-Cost-Path Predictive Model

The above maps, show two layouts of a least cost path predicted for a potential location of "Camino de Mulas", a historically documented trade route which linked several known locations in colonial Costa Rica and Panama. The rasters were generated based on elevation information from a regional DEM layer, and a shapefile of land cover made available for free by the Costa Rican government.
Both layouts show the likely route of the path, with a various emphasis on the two sets of data used to create the weighted overlay. The first weighted overlay (and most likely the more accurate one) based the likely path location by relying on the elevation data as 60% of input and current land cover as 40%. The figure on the right, weighs these factors at 80% and 20% respectively.
Surface Interpolation Analysis
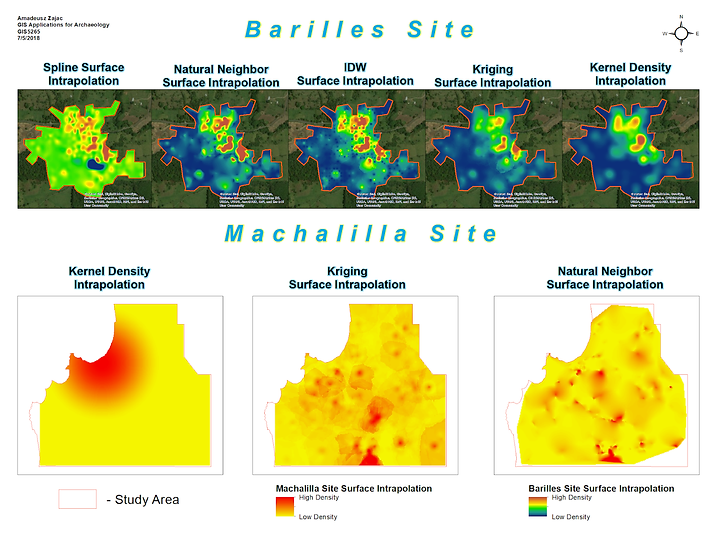
The models represented above show five distinct methods of running a surface interpolation analysis. The point of surface interpolation is to generalize the overall area based values obtained from known within the region. In this case, it was used on two distinct archaeological sites with the main purpose of predicting artifact density based on the amount of artifacts recovered from specific areas of the site.
Kriging Analysis
The following examples shows my implementation of the Kriging and the IDW Kernel Analysis techniques to a personal project at work. The points within the general area represent a grid of shovel test pits which were excavated on location.
The Kriging analysis method tends to generate its predictibility model based on the overall area taken into account when generating the model.

IDW Kernel Analysis

The IDW kernel density model focuses on the values exhibited by specific points (in this case the density of archaeological finds). The surrounding areas were generalized based on their direct proximity to value quantities observed in the positive and negative shovel test pits.
*The site location has been cropped out from each image, for the purpose of protecting site integrity.
Benthic and Bathymetric Predictive Modeling


The two maps above, represent a marine archaeology study meant to predict potential locations for finding shipwrecks within the Biscayne Bay area on the south Atlantic coast of Florida. The circular charts represented at the top of the example show the benthic classification of areas surrounding the known shipwreck locations (known as the Maritime Heritage Trail), and defines the classes that immediately surround them within a 300 foot buffer.
With this information in mind, a predictive model was created to show the areas of high potential when surveying the bay for unknown shipwrecks. This information, combined with the classified bathymetry layer was later used to create an overlay raster for three small areas where these two rasters overlap.
(see below)

bottom of page